

Technical and On-Chain
Where is the current lull taking us? Also, a real rate update...
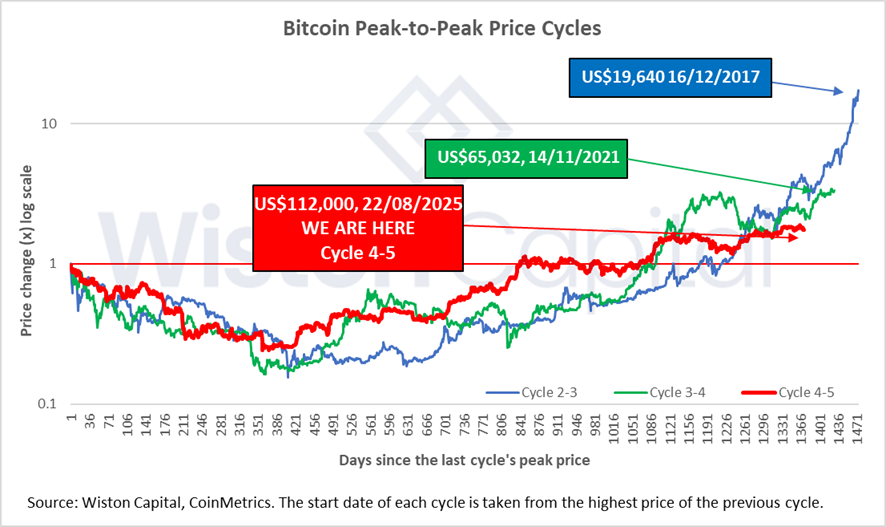
Having run to over US$124,000 a week ago, the drift back to the previous support level at US$112,000 has been a mild surprise, but we warned that things were a bit too quiet. There is no reason to be remotely alarmed. Bitcoin eco-system fundamentals continue to improve and we expect adoption to move into overdrive in the autumn. Nothing we see is consistent with the “end of the cycle”, not least because we consider the classic bitcoin halving cycles to be a thing of the past.
We wouldn’t mind if we were wrong about the end of cycles, because if the past is any guide, what happens next is spectacular (see below). It just doesn’t make huge sense logically, given that annual new supply of bitcoin now only stands at 0.8%. Why does a reduction to 0.4% make a great difference?
Levels are important with bitcoin, because the valuation is unanchored in any sort of orthodox sense. It makes sense for large size buyers to set obvious accumulation levels, and similarly for profit-takers to set downside limits. Hence why breaking levels is important.
We must therefore be vigilant, and aware of the parameters around which we trade.
The chart below shows price undulation through a regular pattern of levels (shown in log scale) since the lows of 2022. We are in the middle of that range now, as shown by the dashed lines. Extrapolating the trend until year end (green line) and we have a price range somewhere between US$128,000 and US$168,000.
The downside risk in the near term is around US$101,000 (lower dashed line), but strong support at US$112,000 makes more sense to us. Note how the RSI in the lower chart is back to the last level that preceded a bounce.
Keep reading with a 7-day free trial
Subscribe to CHAINLETTER to keep reading this post and get 7 days of free access to the full post archives.